Bitcoin Price Analysis: Is BTC in the Calm Before the Storm?
The cryptocurrency market has been experiencing a peculiar period of stagnation. Bitcoin (BTC) has been trading sideways within a narrow range, leaving traders and investors uncertain about its future trajectory. In this analysis, we’ll delve into the current state of the market, examining the technical indicators and on-chain metrics to determine whether this calm before the storm or a sign of a prolonged period of stability.
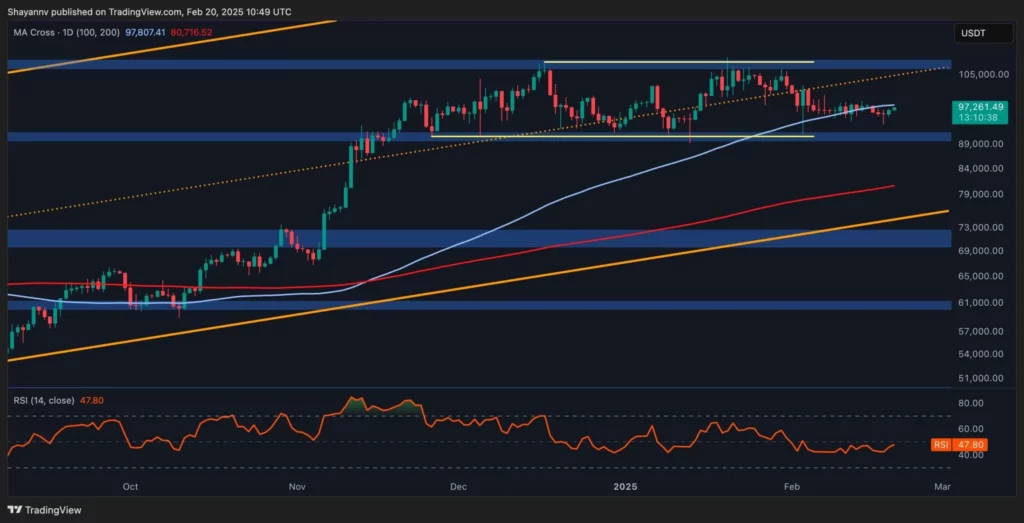
The price action appears stagnant, with the daily chart displaying an extended period of sideways trading. This lack of directional movement has led to increased uncertainty among traders, as they struggle to predict the next course of action for the cryptocurrency. The RSI indicator remains relatively neutral, hovering around 50, highlighting a state of equilibrium between buyers and sellers.
To establish a clear trend, higher trading volume is necessary. In the absence of such activity, we can only speculate about the potential future trajectory. However, considering multiple key support levels, it’s likely that the price will find solid footing around the $90K threshold, potentially leading to a significant surge towards the $108K mark.
Moving on to the 4-hour chart, a strong support region has emerged within the $92.5K-$94.3K fair value gap, repeatedly thwarting sellers’ attempts to push prices lower. This area is not only a demand magnet but also aligns with the prolonged ascending wedge’s lower boundary and the short-term bullish flag’s lower trendline. Therefore, it can be expected that increased buying activity will occur at this level, potentially prompting a surge towards the flag’s upper boundary at $98K before targeting the $108K mark.
In addition to these traditional technical indicators, we’ll also examine on-chain metrics for further insights. Analyzing futures market data, including open interest and other market dynamics, can provide valuable information about the current situation. The chart illustrates Bitcoin’s open interest metric, which measures the total number of open perpetual futures contracts on centralized exchanges.
The graph reveals that despite the cryptocurrency’s recent price fluctuations and indecision, open interest has been trending upward. This increase in activity could result in a major breakout within the mid-term. However, it is essential to understand that this information alone cannot accurately predict the direction of the future market movements.
As Bitcoin continues its current sideways trading, investors must remain cautious about any potential risks. The cryptocurrency’s price movement remains uncertain and requires further research before establishing a clear long-term outlook.
Source: cryptopotato.com